How to represent digital images?
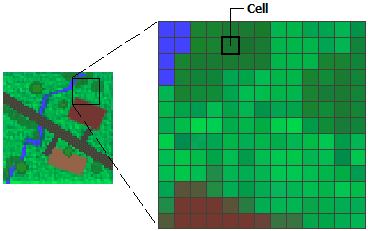
The most common approach to store a digital image is using a Raster data structure. You can think of a raster as a 2D array (or a grid) of cells (or "pixels") organized into rows and columns, where each cell contains a value representing color information.
Java comes with the BufferedImage class that implements the raster data structure. Let's open an image file and store it as BufferedImage. Open the Demo.java file. Notice the statements in the main method:
BufferedImage image = ImageUtility.getBufferedImage("tiny/color.png");
Color[][] pixels = ImageUtility.getPixels(image);
ImageUtility.printColors(pixels);
The ImageUtility provides you with several helper methods. Feel free to skim over its content but don't spend too much time on it. In particular, if you are running IntelliJ on Windows, you must follow the TODO instruction in ImageUtility.getBufferedImage method.
The Color class is built into Java. As the name suggests, it encapsulates a "color" value: a 3-tuple of primary colors: Red, Green, and Blue (or RGB).
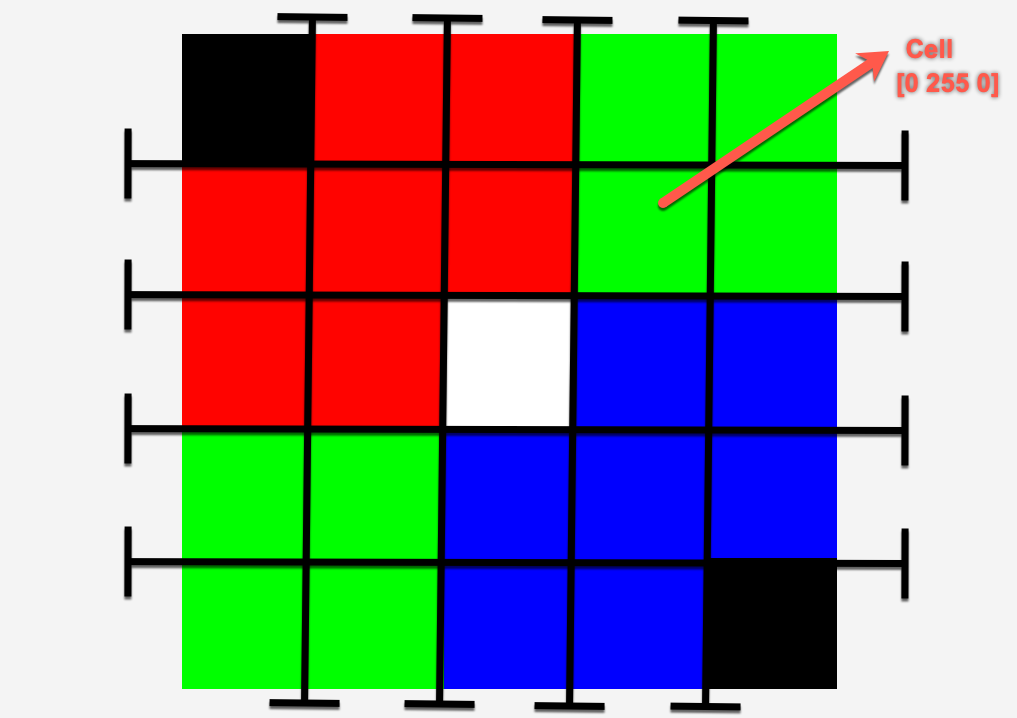
Run the main method. It must print the following values:
[0    0    0]	[255  0    0]	[255  0    0]	[0   255   0]	[0   255   0]

[255  0    0]	[255  0    0]	[255  0    0]	[0   255   0]	[0   255   0]

[255  0    0]	[255  0    0]	[255 255 255]	[0    0  255]	[0    0  255]

[0   255   0]	[0   255   0]	[0    0  255]	[0    0  255]	[0    0  255]

[0   255   0]	[0   255   0]	[0    0  255]	[0    0  255]	[0    0    0]
Notice the output is a $5$-by-$5$ grid. Each cell contains a 3-tuple of RGB values. For example, [255 0 0] means that this cell has 255 units of "red" and 0 units of "green" and "blue." As a result, this cell will appear red!
Here is a legend for understanding other color values: (You don't need to remember these!)
[0 0 0]appears as black[255 255 255]appears as white[255 0 0]appears as red[0 255 0]appears as green[0 0 255]appears as blue
Please open the color.png file in IntelliJ. This file is located inside the src/main/resource/tiny folder.
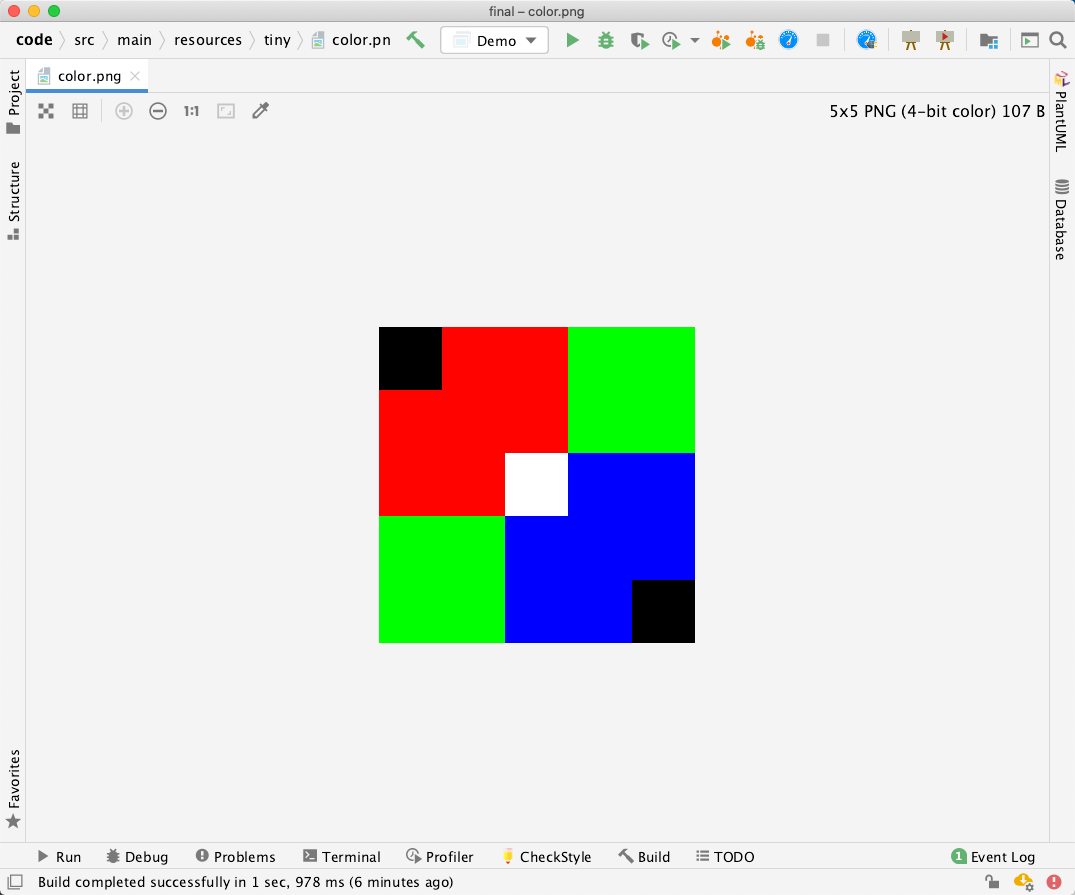
This image is only $5$-by$5$ pixels! If you were to open it directly in your operating system, you would have a hard time seeing it! However, IntelliJ scales it up for better viewing. Notice the correspondence between the color pattern in the image and the printed RGB pixel values from the demo program.
There are several other image files inside the src/main/resource/tiny folder. Please adjust the demo program to open each and print their RGB pixel values. Notice, for example, for white.png, all pixel values are [255 255 255].
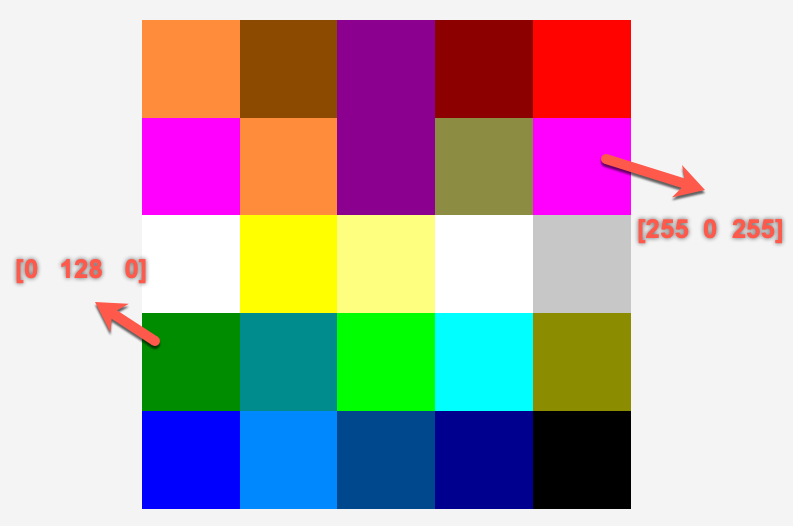
All colors can be generated by varying the RGB values. For instance, open the chart.png image in IntelliJ and in the demo program. Pay attention to the RGB values. If you wonder why the RGB values are between $0$ and $255$, that is because each primary color value is stored in $8$ bits ($1$ byte). $8$ bits represents $2^8 = 256$ intensity levels $(0-255)$.
You can think of a rasterized image (i.e., an image represented using a raster data structure) as a connected graph where each pixel is a node, and it is connected to four other pixels to its north, south, east, or west (if such pixels exist).
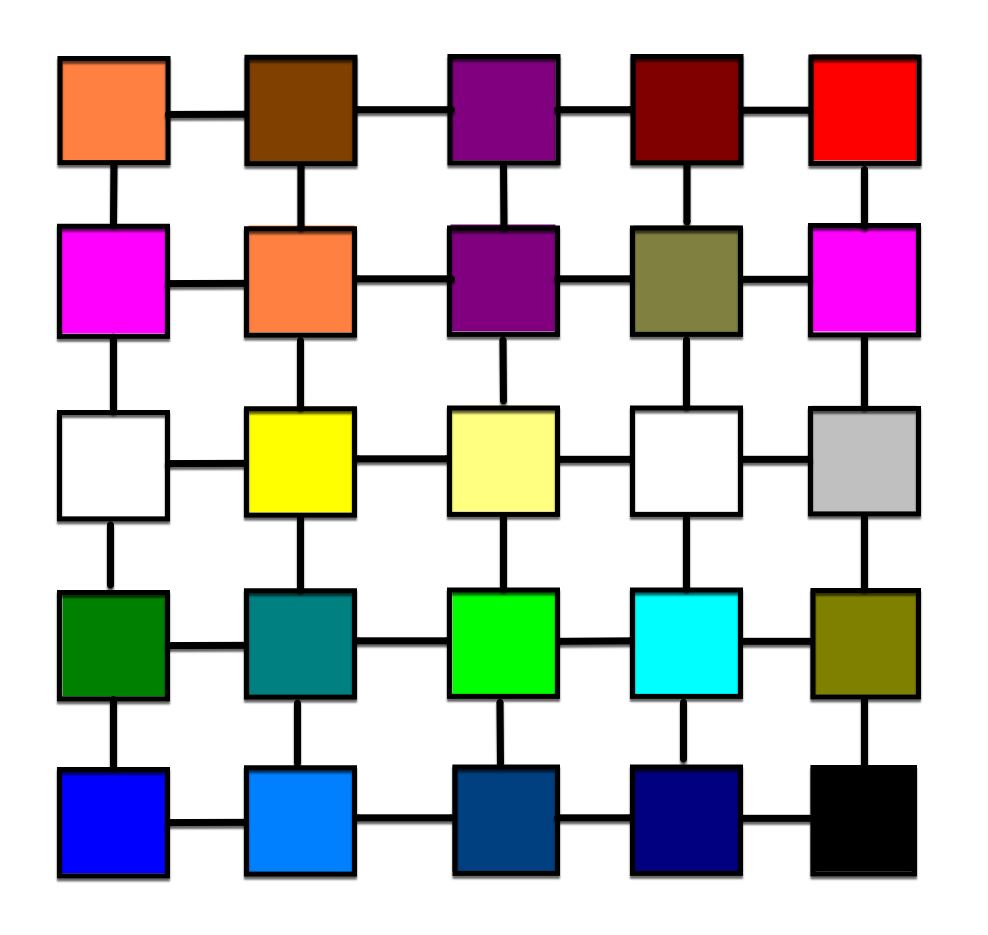
When we interpret an image as a graph, we can formulate image analysis and processing problems as "graph problems" and solve those problems using "graph algorithms."
Resources
These resources are provided for completeness; you do not need to consult any of these for this take-home exam!
- Wikipedia's entry on Raster graphics.
- Wikipedia's entry on Pixel.
- Wikipedia's entry on RGB color model.
- Wikipedia's entry on Image analysis.
- Wikipedia's entry on Digital image processing.